The NetMan Statistics program can generate graphic displays of the data in your tables. When you select this function, a graph is generated from the table currently loaded in NetMan Statistics.
![]() To view graphs in the Statistics program you need to install the Adobe Flash Player plug-in.
To view graphs in the Statistics program you need to install the Adobe Flash Player plug-in.
You can make graphs of the following table types:
•Main table
•Table of concurrent use
You can choose from the following types of graph:
•Bar chart
•3D bar chart
•Cylinder bar chart
•Line chart
•Area chart
•Pie chart
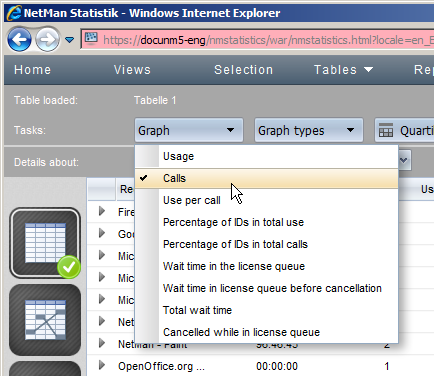
Graphic output can be generated from a main table for the following data:
•Usage
•Calls
•Use per call
•Percentage of IDs in total use
•Percentage of IDs in total calls
•Wait time in license queue
•Total wait time
•Cancellations in license queue
Graphic output can be generated from a concurrent use table for the following data:
•Maximum concurrent use (all record IDs)
•Maximum concurrent use (one ID)
Proceed as follows to generate graphical output from your calculations:
1. Click on Graph in the taskbar of the desired table and select the data to be included in the chart:
2. To change the chart, click on Graph types and select the desired type.