This chapter describes the functions of the H+H Trace Monitor. The Trace Monitor is a Monitoring-tool that displays the trace messages from programs and NetMan Desktop Manager functions. The H+H Trace Monitor lets you monitor NetMan program processes and can help you locate the source of any problems that may occur. To open the Trace Monitor, use the NetMan Tools desktop shortcut or the shortcut in the Start menu under All Programs/H+H NetMan.
![]() Trace Monitor is available only in English.
Trace Monitor is available only in English.
The main window shows messages indicating the status of internal processes:
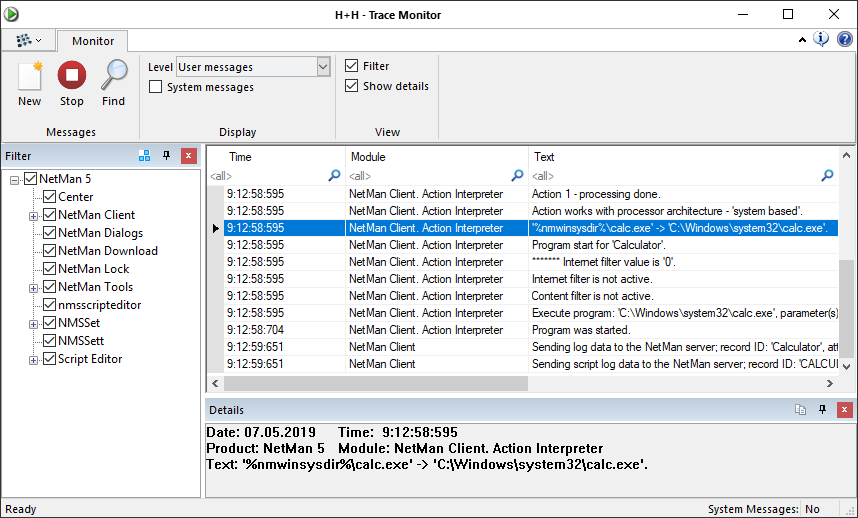
With the initial (default) settings, on the left side of the main window, you see the Filterselection window. Trace messages are shown in the Output window on the right. What messages are shown, and in what form, depends on your selection of programs, modules, columns and output level. The Details window shows details on the selected item.
This table has the following columns:
No. No. Number of the entry in the current Trace Monitor document.
Date. The date on which the message was recorded.
Time. The time at which the message was recorded.
PID. Product identification number.
Product. Name of the program from which the message originated.
Module. Program module that sent the message.
Text. Contains the actual event message.
To configure which columns are displayed, open the “Field Chooser“. To highlight the entries in the output window select colors in the Color selection dialog. You see at a glance which modules sent which messages.
Show console messages
By default, the Trace Monitor shows the trace messages from the session which you are currently using. If your session is running on the remote desktop session host, you can view server console messages as well. To do this, click on System messages in the ribbon. Trace Monitor shows now trace messages from the console session as well.
Program menu commands
Open. Opens an existing document.
Save. Saves the active document.
Exit. Closes the Trace Monitor.
Commands in the ribbon
New. Clears the display and creates a new document.
Stop. Stops the output of trace messages.
Find. Starts a search for the specified text.
Level. Specifies the output level of trace messages:
•Error messages. Shows only error messages.
•User messages. Shows the messages concerning the logged-in user.
•Development messages. Shows messages for developers.
System messages. Shows trace messages from the server console.
Filter. Displays the Filter selection window.
Show details. Displays the detail window.
Commands in the detail window
Copy. Copies the selection to the Clipboard.