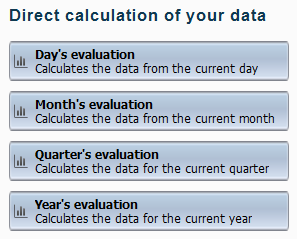
The fastest way to calculate your data was shown in the previous chapter, "Statistics". It involves selecting the periods analyzed directly on the Statistics main page:
In this calculation, the time period is the only criterion applied. If you wish to apply different or additional criteria, you need to select the desired criteria first and then run the calculation on the new basis. This procedure is described in the following:
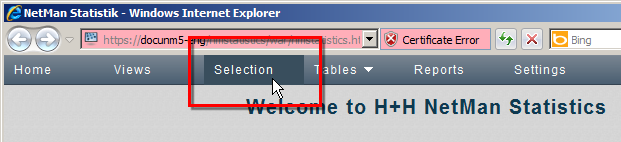
1. Select the criteria for calculation in the Selection view: Click on Selection in the main window of the Statistics program:
2. In the selection view, choose the criteria for calculation of your data:
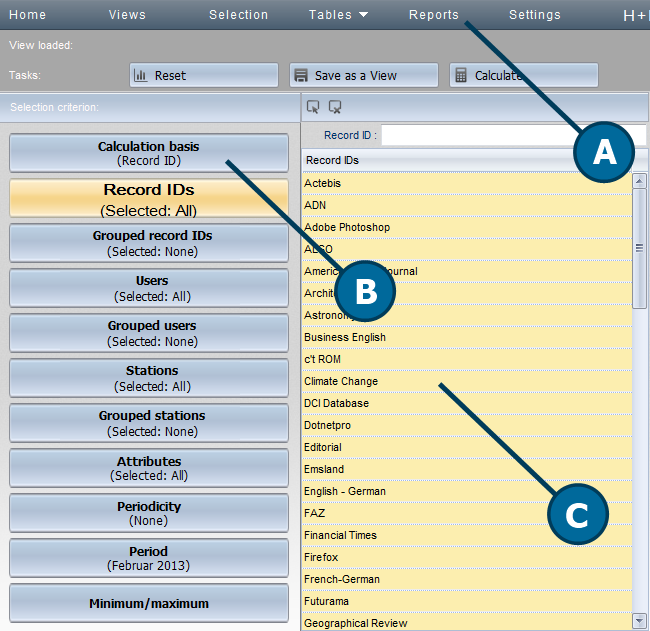
A. Task bar. Contains links to tools for such tasks as calculating data and saving views.
B. Selection sidebar. Contains buttons for selecting calculation criteria.
C. Detail window. Here you can define the exact criteria to be applied for calculation.
![]() The input field in the detail window lets you query certain data that matches the criteria of the string entered.
The input field in the detail window lets you query certain data that matches the criteria of the string entered.
Commands in the task bar
Reset. Resets your selection and any active view.
Save as a View. Saves the selected calculation criteria as a view. For details on working with views, see " Create Views ".
Calculate. Calculates a table using the selected criteria.
For information on the available calculation criteria, see "Calculation Criteria“.
3. After selecting the desired criteria, click on Calculate button.
4. In the Calculate a table dialog, select the desired table: The table is created in accordance with the selected criteria. For details on the different types of table, see "Main Table", "Cross Table" and "Table of Concurrent Use“. If you repeatedly use the same set of criteria as the basis of calculation, we recommend saving the defined set of criteria in what is called a View. A view stores your settings for a given calculation. Working with views you can use the same criteria again as often as you like without having to select the criteria each time. For details on working with Views, see "Create Views“.
In the selection sidebar, you can choose from the following calculation criteria:
Calculation basis:
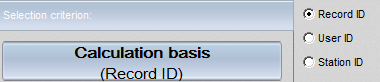
Record ID. Your calculations are based on usage per record ID.
User. Your calculations are based on usage per user.
Station. Your calculations are based on usage per station.
Record IDs:
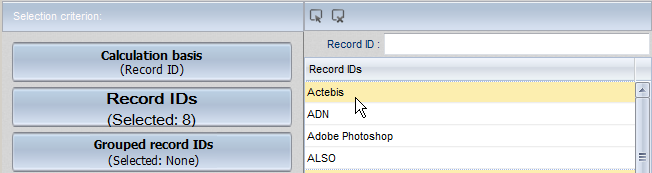
Here you can select the record IDs you wish to include in the calculation. In the detail window you see the query field Record IDin which you define query criteria. As long as nothing is entered here, only a note that all or no data sets are selected is displayed. The details window lists the record IDs of all records. Click on a record ID to select it or deselect it. Use the buttons above the list to select all or none of the record IDs. Record IDs selected for inclusion in the calculation are highlighted in yellow.
Grouped record IDs:
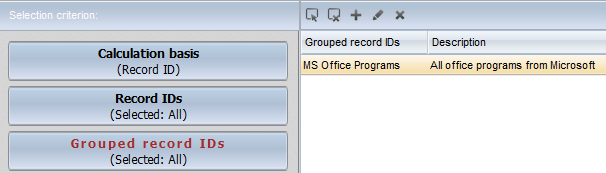
The term "grouped" refers to cumulative data records that are calculated together. Any time you calculate multiple datasets for better clarity, you are creating groups. You can group record IDs as well, to create record ID groups. Use the buttons above the list to create and edit grouped record IDs:
Select all. Selects all grouped record IDs.
Deselect all. Deselects all grouped record IDs.
New. Generates a new grouped record ID.
Edit. Edits the selected grouped record ID.
Delete. Deletes the selected grouped record ID.
For details on creating and editing grouped data, see "Create Grouped Data“.
Users:
Here you can select the users you wish to include in the calculation. The details window lists the users contained in all records. You can use this list in the same manner as that described above for processing record IDs.
Grouped users:
User data is summarized as grouped users. Use the buttons above the list to create and edit grouped users.
Stations:
Here you select the stations you wish to include in the calculation. The details window lists the stations contained in all records. You use this list in the same manner as that described above for processing record IDs.
Grouped stations:
Station data is summarized as grouped stations. Use the buttons above the list to create and edit grouped stations.
Periodicity:
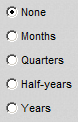
Periodicity defines the time periods applied in the table of periods. With the default settings, the periodicity of the data in the NetMan Statistics program is daily. This is the periodicity when None is selected. If you wish to apply a different periodicity, select the corresponding setting here (months, quarters, half-years, or years).
Period:
Select the period for which you wish to calculate data. With the default settings, the Statistics programs includes the entire period from the first data record to the most recent. The only periods additionally offered for selection are those which match the scheme selected under Periodicity. If None is selected, for example, then the period is defined in days:
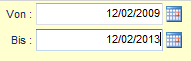
The Calendar buttons to the right of the input fields let you select dates rather than entering them.
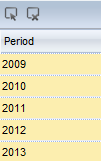
If the periodicity is set to "Years," a list of years is opened for selection:
Minimum/maximum:
You may at times find that you have a lot of data records that you wish to exclude from analysis, because you know they actually indicate errors. Such records might show, for example, a remarkably long period of usage (e.g. over 12 hours) or a particularly short period (less than a minute). In the former case was the program and the session were left open, but not used. As to the latter instance, it is clear that the program was not actually used. At most, this data record might be useful in error diagnosis, but not in usage statistics. The option of defining minimum and maximum criteria in the NetMan Statistics program gives you an easy way to exclude such error cases from your calculations. Only the data records within your defined limits are used in your calculations:
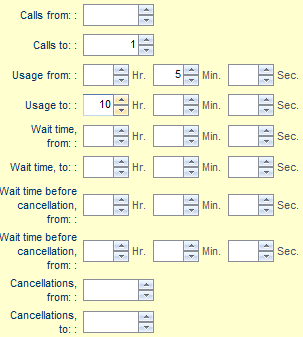
•Calls: Defines a minimum and a maximum value for the absolute number of application calls.
•Usage: Defines the shortest and the longest usage periods to be included.
•Wait time: Defines the shortest and the longest times spent waiting for an application license to become available before the application started.
•Wait time before cancellation: Defines the shortest and the longest times spent waiting for an application license to become available before the user cancelled the application call.
•Cancellations: Defines the minimum and maximum numbers of times a user left the license queue by cancelling the application call.
In the example shown above, a minimum of 1 application call has been defined. This means that programs that were not called will not be included in the calculation. For usage, a minimum value of five minutes and a maximum of ten has been entered. Programs that ran for less than five minutes or longer than ten hours are excluded from the calculation.