The main table shows variables such as total use, total calls or time in license queue, with a selected calculation base – either record ID, user or station, or grouped data you can define yourself. For details on calculating a main table, see "Calculate Data". This chapter shows you the options available in the main table for data evaluation. Once you have calculated the data, the main table is displayed as follows:
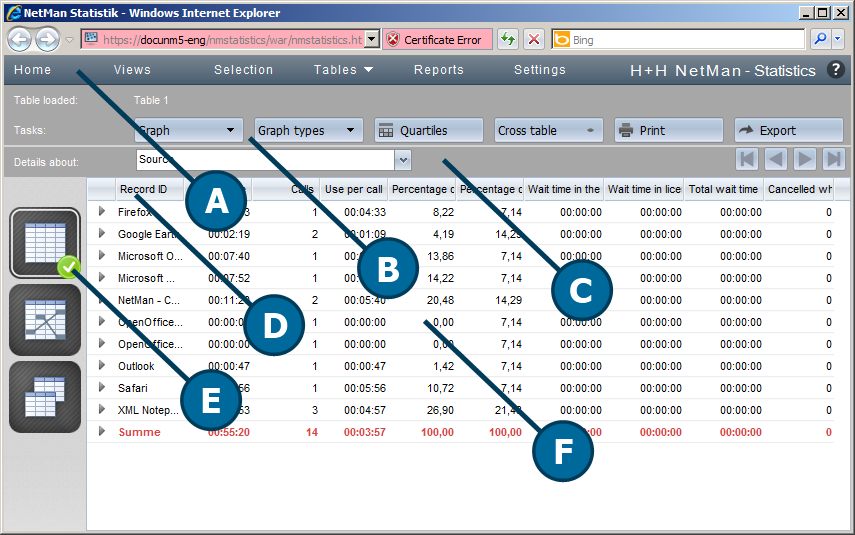
A. Menu bar. In the menu bar you can select optional functions such as Views or Reports, or open the Settings program. For a description of the menu bar, see "Statistics".
B. Task bar. The task bar gives you access to all commands available for use with the main table.
C. Navigation bar. The navigation bar lets you change the basis of the data record detail view and navigate existing tables.
D. Column header. The column header let you sort the data records by the contents of the columns, in either ascending or descending order. Simply click on the header of a given column to sort the data by the content of that column.
E. Table selection. Here you can select which table is displayed. You can use the chosen data records to calculate a main table, a cross table or a table of concurrent use.
F. Table. The table shows all calculated data records. You can open a Detail view for any data record in the table to see all of the data contained in that record. For details on using this function, see "Data Record Details".
Commands in the task bar
Graph. Select the basis for plotting your data on a chart.
Graph types. Select the type of graph for plotting your data on a chart. For details on creating graphs, see "Create Graphs".
Quartiles. Activates the display of quartiles, which shows the cells in different colors by quartile for a better overview. You can see at a glance where the high and the low values occur.
Cross table. Select the calculation basis for a cross table.
Print. Prints the active table or graph.
Export. Exports your data in a format you can open, for example, in Excel.
Report. Creates a report. For details using reports, see "Create Reports".
Current selection. Opens a window showing the current calculation criteria.
Elements in the navigation bar
Details about. Defines what is shown in the Detail view. For details on using this function, see "Data Record Details".
The navigation buttons on the right let you navigate existing tables and graphs.
Elements in the table selection sidebar
Main table. Calculates a main table.
Cross table. Calculates a cross table. For details on calculating a cross table, see "Cross Table".
Concurrent use table. Calculates a table of concurrent use. For details on calculating a table of concurrent use, see "Table of Concurrent Use".
Optional elements:
Graph. Shows an existing graph. For details on creating graphs, see "Create Graphs".
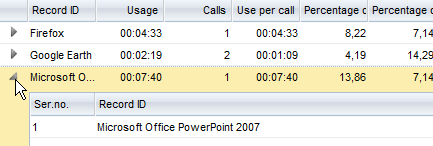
You can open a Detail view for any data record, to view data record contents in detail. To open a Detail view, click on the "Expand" icon to the left of the desired record.
![]() No data has been logged in the User and Station columns of this record. This is in accordance with a data security policy in NetMan Desktop Manager. Data on users and stations is generally logged only for error diagnostics. You can activate logging of user and station data manually. If you decide to log these data in spite of data security issues, you can activate data logging in the NetMan section of the NetMan Settings program, on the Data Logging page.
No data has been logged in the User and Station columns of this record. This is in accordance with a data security policy in NetMan Desktop Manager. Data on users and stations is generally logged only for error diagnostics. You can activate logging of user and station data manually. If you decide to log these data in spite of data security issues, you can activate data logging in the NetMan section of the NetMan Settings program, on the Data Logging page.
The Detail view shows all of the data in a data record in detail. You can modify the display in the Detail view by changing the setting in the navigation bar, in the Details about field.
![]() If a Detail view is already open when you change the "Details about" settings, you need to close it and the open it again to see the effects of the change.
If a Detail view is already open when you change the "Details about" settings, you need to close it and the open it again to see the effects of the change.
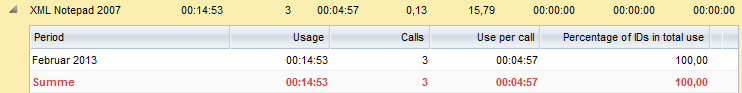
The following example shows a Detail view based on periods: