The concurrent use table in NetMan Desktop Manager is specifically intended for calculating application license usage. In general, this is a table that shows parallel usage. Specifically, the data it delivers can help you regulate licensing in your NetMan Desktop Manager system so that you have enough licenses to cover your requirements, but not too many. For details on calculating a table, see "Calculate Data". This chapter gives you an overview of the functions in the table of concurrent use. After calculation of a concurrent use table, the display contains the following:
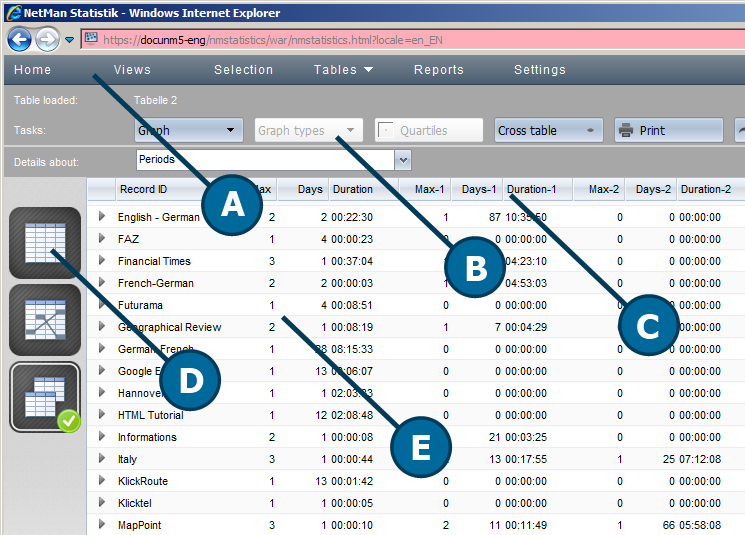
A. Menu bar. In the menu bar you can select optional functions such as Views or Reports, or open the Settings program. For a description of the menu bar, see "Statistics".
B. Task bar. The task bar gives you access to all commands available for use with the main table.
C. Column header. The column headers let you sort the data records by the contents of the columns, in either ascending or descending order. Simply click on the header of a given column to sort the data by the content of that column.
D. Table selection. Here you can select which table is displayed. You can use the chosen data records to calculate a main table, a cross table or a table of concurrent use.
E. Table. The table shows all calculated data records. You can open a Detail view for any data record in the table to see all of the data contained in that record. For details on using this function, see "Data Record Details".
Commands in the task bar
Graph. Select the basis for plotting your data on a chart. For details on creating graphs, see "Create Graphs".
Quartiles. Activates the display of quartiles, which shows the cells in different colors by quartile for a better overview. You can see at a glance where the high and the low values occur.
Cross table. Select the calculation basis for a cross table.
Print. Prints the active table or graph.
Export. Exports your data in a format you can open, for example, in Excel.
Report. Creates a report. For details using reports, see "Create Reports".
Current selection. Opens a window showing the current calculation criteria.
Elements in the navigation bar
Details about. Defines what is shown in the Detail view. For details on using this function, see "Data Record Details".
The navigation buttons on the right let you navigate existing tables and graphs.
Elements in the table selection sidebar
Main table. Calculates a main table. For details on calculating a main table, see "Main Table".
Cross table. Calculates a cross table. For details on calculating a cross table, see "Cross Table".
Concurrent use table. Calculates a table of concurrent use.
Optional elements:
Graph. Shows an existing graph. For details on creating graphs, see "Create Graphs".
Columns in the table
Record ID. The record ID is a unique identifier for recording program usage. This program was in use.
Max. The highest number of instances of parallel use of this ID, or of the program.
Days. Number of days on which the maximum parallel use was reached.
Duration. The duration of maximum parallel use.
Max-1. The second highest number of instances of parallel use for this ID/program.
Days. Number of days on which the second highest level of parallel use was reached.
Duration. The duration of the second highest parallel use level.
Max-2. The third highest number of instances of parallel use for this ID/program.
Days. Number of days on which the third highest level of parallel use was reached.
Duration. The duration of the third highest parallel use level.
The fourth and fifth highest levels are of parallel usage are logged in the same manner.
Elements in the table selection sidebar
Main table. Calculates a main table. For details on calculating a main table, see "Main Table".
Cross table. Calculates a cross table.
Concurrent use table. Calculates a table of concurrent use. For details on calculating a table of concurrent use, see "Table of Concurrent Use".
Optional elements:
Graph. Shows an existing graph. For details on creating graphs, see "Create Graphs".