The cross table relates certain variables in your calculation to other variables. Use can use this function, for example, to check which record IDs were used during which periods, how often or for how long. The following mutually independent variables are available:
•Record ID
•User
•Stations
![]() With the default settings, no data are logged for users or stations. This is in accordance with a data security policy in NetMan Desktop Manager. Data on users and stations is generally logged only for error diagnostics. You can activate logging of user and station data manually. If you decide to log these data in spite of data security issues, you can activate data logging in the NetMan section of the NetMan Settings program, on the Data Logging page.
With the default settings, no data are logged for users or stations. This is in accordance with a data security policy in NetMan Desktop Manager. Data on users and stations is generally logged only for error diagnostics. You can activate logging of user and station data manually. If you decide to log these data in spite of data security issues, you can activate data logging in the NetMan section of the NetMan Settings program, on the Data Logging page.
The following mutually independent variables are available:
•Periods
•User
•Stations
You can calculate the following in the cross table:
•Total usage
•Usage time as percentage of total use
•Usage time as percentage of total use for the ID
•Absolute values for calls
•Call count as percentage of total calls
•Calls as percentage of total calls for the ID
Thus the cross tables in NetMan Desktop Manager serve to create relationships between variables; for example, between record IDs and users to answer such questions as: "Which program was used by what user, and how often?"
For details on calculating a table, see "Calculate Data". This chapter shows you the various functions of the cross table. After calculation of a cross table, the display contains the following:
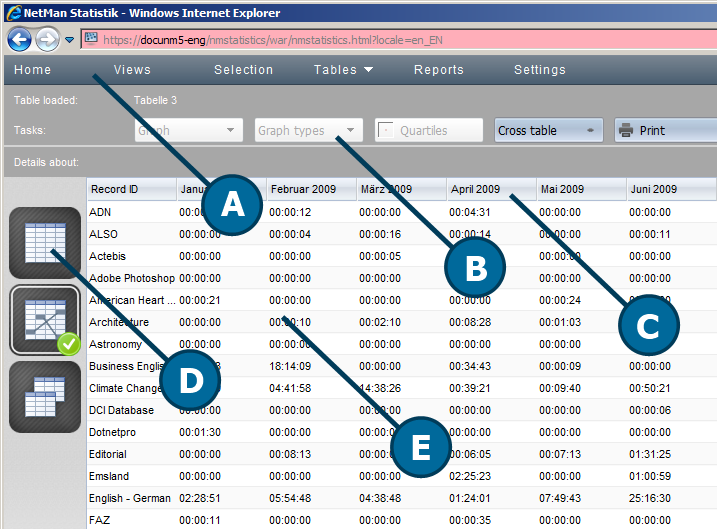
A. Menu bar. In the menu bar you can select optional functions such as Views or Reports, or open the Settings program. For a description of the menu bar, see "Statistics".
B. Task bar. The task bar gives you access to all commands available for use with the main table.
C. Column header. The column header let you sort the data records by the contents of the columns, in either ascending or descending order. Simply click on the header of a given column to sort the data by the content of that column.
D. Table selection. Here you can select which table is displayed. You can calculate a main table or a table of concurrent use from the data records.
E. Table. The table shows all calculated data records.
Commands in the task bar
Cross table. Select the calculation basis for a cross table.
Print. Prints the active table or graph.
Export. Exports your data in a format you can open, for example, in Excel.
Report. Creates a report. For details using reports, see "Create Reports".
Current selection. Opens a window showing the current calculation criteria.
Elements in the navigation bar
The navigation buttons on the right let you navigate existing tables and graphs.
Elements in the table selection sidebar
Main table. Calculates a main table. For details on calculating a main table, see "Main Table".
Cross table. Calculates a cross table.
Concurrent use table. Calculates a table of concurrent use. For details on calculating a table of concurrent use, see "Table of Concurrent Use".
Optional elements:
Graph. Shows an existing graph. For details on creating graphs, see "Create Graphs".