The NetMan Desktop Manager statistics program gives you the data you need for detailed analysis of application usage in your system. Simply put, you can access all of the data that shows who used what, where, and for how long. In addition, the statistics program provides tools for analyzing and even charting the data. Prerequisite is that you configure NetMan Desktop Manager to log application usage data.
![]() Before you can open the Report Center or the statistics program, you have to log in on the NetMan Desktop Manager web server. Only NetMan administrators have unrestricted access to the statistics.
Before you can open the Report Center or the statistics program, you have to log in on the NetMan Desktop Manager web server. Only NetMan administrators have unrestricted access to the statistics.
![]() The NetMan Desktop Manager Report Center is a Web application. You can call the Report Center/Statistics program from the browser on any system. Prerequisite is that you authenticate yourself at the NetMan Web Server with sufficient permissions. The direct link to the Report Center is: https://<NetMan Server>/nmwebapps/NMWebApps.html. The name of the NetMan Desktop Manager server is usually his FQDN, depending on your network configuration the NetBIOS name or an IP address can also be used.
The NetMan Desktop Manager Report Center is a Web application. You can call the Report Center/Statistics program from the browser on any system. Prerequisite is that you authenticate yourself at the NetMan Web Server with sufficient permissions. The direct link to the Report Center is: https://<NetMan Server>/nmwebapps/NMWebApps.html. The name of the NetMan Desktop Manager server is usually his FQDN, depending on your network configuration the NetBIOS name or an IP address can also be used.
This section describes how to activate data logging, run the statistics program and use the basic functions in the NetMan Statistics program. It also describes a shortcut for producing a rapid evaluation of your data.
Data logging is a property of the Program and Hyperlink actions. You can activate or deactivate data logging for each of these actions separately. This means you can record data from every program script or URL script. You can activate or deactivate data logging for the program actions and URL actions in advanced scripts. You can also add program actions or URL actions to NetMan startup and shutdown scripts to log data from them as well. For program or URL scripts, data logging is activated in the script editor on the corresponding page:
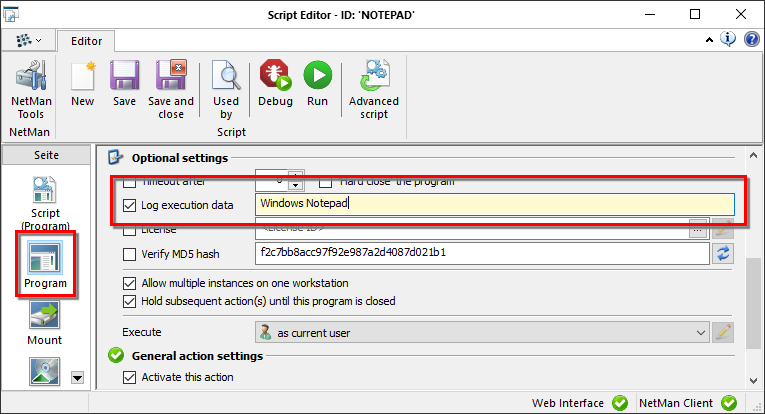
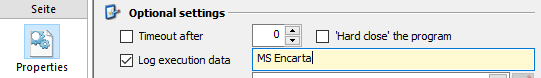
For actions, data logging has to be activated on the action's properties page:
When program or hyperlink data is logged, a dataset is added to the NetMan Desktop Manager call log with every program or hyperlink call. You can view the call log directly, without running the statistics program. For details on viewing the call log, see "Call Log“.
Once you have data in the call log, you can open the statistics program to evaluate it.
Logging user and station data
Immediately following the installation of NetMan Desktop Manager; i.e., with the default settings, user and station data is not logged. This is in accordance with a data security policy in NetMan Desktop Manager. Data on users and stations is generally logged only for error diagnostics. You can activate logging of user and station data manually. If you decide to log these data in spite of data security issues, activate data logging on the Data Logging page under NetMan in the NetMan Settings program:
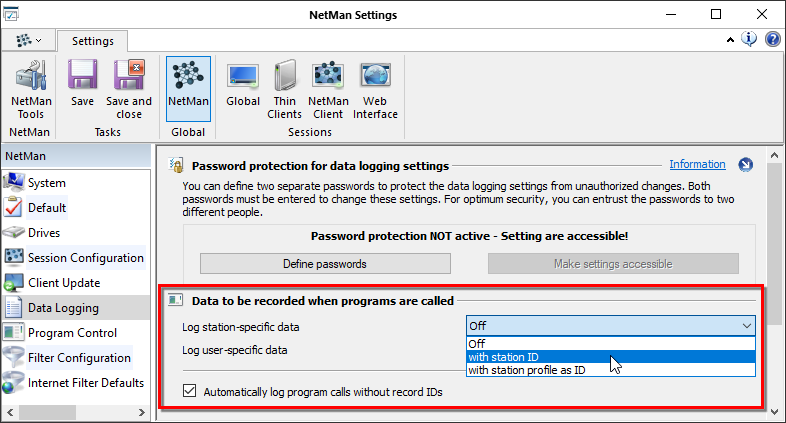
Log station-specific data:
•Off. User/station data is not logged.
•with user [or station] ID. Users and station data is recorded under the respective user ID/station ID.
•with user [or station] profile as ID. Users and station data is recorded, but is identified only by user's/station's profile ID. This option lets you protect the privacy of individual users while still obtaining meaningful data for evaluation.
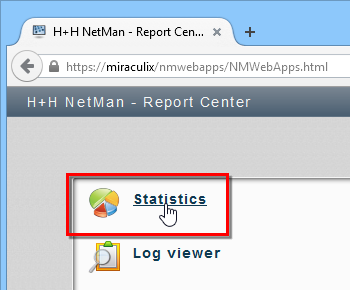
Running the statistics program
Select this program in the NetMan Report Center. You can open the Report Center from the NetMan Tools desktop shortcut. In the Report Center, select Statistics:
![]() The NetMan Report Center is opened via the NetMan Web Server. Before you can use the Report Center, you must log on to the NetMan Web server. Thus when you click on the NetMan Report Center link, you are redirected to a login page for logging in on the web server. You cannot access the Report Center functions until you have logged on successfully.
The NetMan Report Center is opened via the NetMan Web Server. Before you can use the Report Center, you must log on to the NetMan Web server. Thus when you click on the NetMan Report Center link, you are redirected to a login page for logging in on the web server. You cannot access the Report Center functions until you have logged on successfully.
![]() If a certificate error is reported when loading the Report Center or the statistics program, that means no valid certificate has been registered for the web server. For details on requesting and importing certificates, see "Certificates for the NetMan Web Server“. There is no harm in loading the page when this message is shown; simply select Continue loading the page.
If a certificate error is reported when loading the Report Center or the statistics program, that means no valid certificate has been registered for the web server. For details on requesting and importing certificates, see "Certificates for the NetMan Web Server“. There is no harm in loading the page when this message is shown; simply select Continue loading the page.
Once the statistics program launches, you have access to its full range of functions.
Functions in the statistics program
The main window of the statistics program gives you access to the following functions:
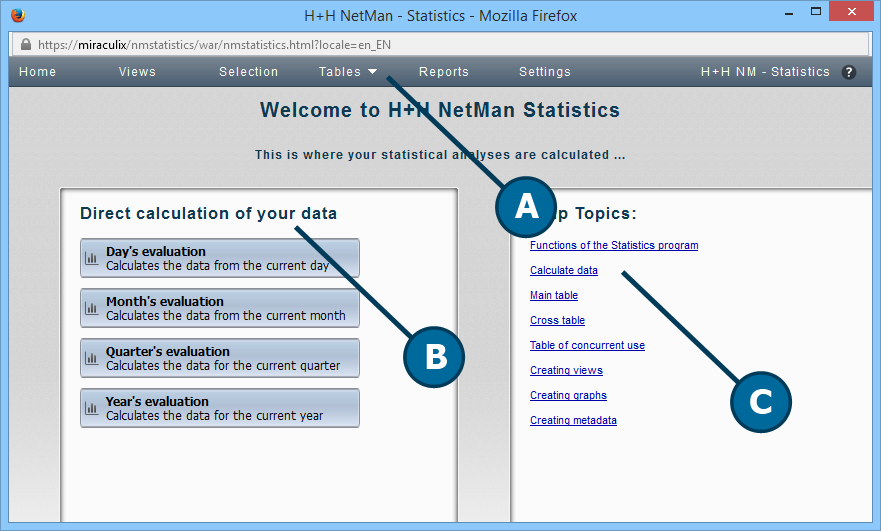
A. Menu bar. In the menu bar you can select optional functions such as views or reports, or open the Settings program.
B. Analysis periods. Here you can select an analysis of data over a defined period.
C. Help Topics. This area presents a selection of help texts on relevant topics.
Commands in the menu bar:
Home. Opens the homepage of the statistics program.
Views. Opens the View browser. Here you manage your saved views.
Selection. Opens the selection view. Here you select criteria for creating a calculation.
Tables. Gives you fast access to calculated tables.
Reports. Opens the Report browser for managing your reports.
Settings. Opens the Settings program for the NetMan statistics.
Calculation with the defined analysis periods
The analysis period selection pane gives you fast access to predefined calculation tables. With just a few mouse clicks, for example, you can calculate a day's data:
1. In the analysis periods pane, click on day's evaluation.
2. In the Calculate a table dialog, select the desired table:
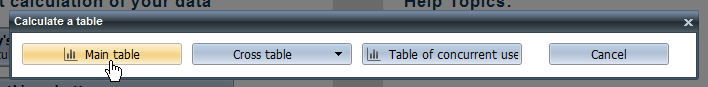
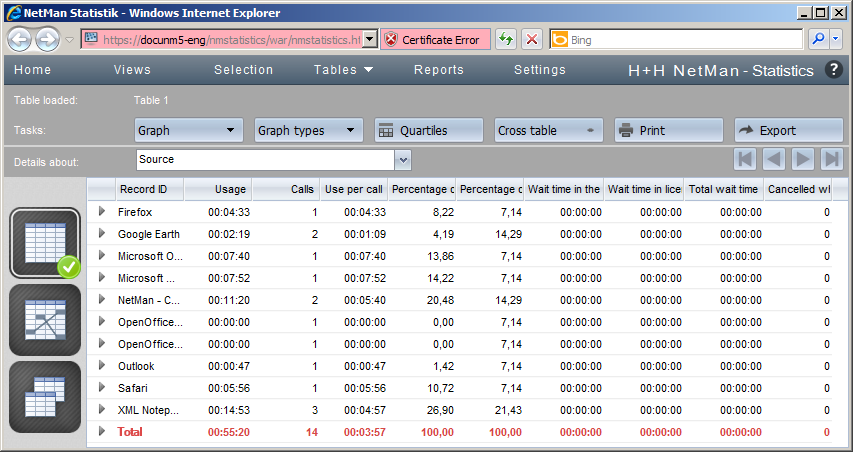
3. This opens an evaluation of the day's usage data in the main table:
The following sections provide details on using the functions in the statistics program:
•“Calculate Data" describes how to use the NetMan Desktop Manager statistics program to analyze datasets.
•“Main Table" describes all functions in the main table.
•“Cross Table" describes all functions in the cross table.
•“Table of Concurrent Use" describes all functions in the table of concurrent use.
•“Create Views" explains how to create and use views.
•“Create Graphs" explains how to make graphs, charts and diagrams based on your tables.
•“Create Grouped Data" describes how to aggregate your data records in groups.
•“Create Reports" describes the use of reports.
•“Statistics Program Settings" describes the options in the statistics program settings.