The NetMan Report Center is an HTML-based set of tools for statistical analysis. The Report Center is far more than just a log file. The following tools are available in the NetMan Report Center:
•Statistics. With the Statistics program, you can create detailed usage statistics on your applications. For details on using the Statistics program, see "Statistics“.
•Log Viewer. The Log Viewer brings together all of the NetMan log files that let you observe system functions; for example, in troubleshooting or system analysis:
•Event Viewer. This log shows general system messages from your NetMan Desktop Manager system. For a clear overview of error message status, the event log is divided into categories. For details on the categories and how to work with the event log, see "Event Log“
•Call Log. The log file shows all usage data and associated information. For details on working with the usage log, see "Call Log“.
•Internet Filter: Activities. The Internet filter activity log shows all details on use of the Internet filter. A new data record is written and listed in this log file each time an access attempt is blocked. For details on working with the Internet filter activity log, see "Internet Filter Activities“.
•Internet Filter: Error Log. This log lists a data record for each error that occurs in an application due to the Internet filter. Prerequisite is a process-based Internet filter. For details on working with the Internet filter error log, see "Internet Filter Error Log“.
•Performance Log. A data record is written in this log each time the values you set for maximum CPU load and number of page faults are exceeded. For details on working with the performance log, see "Performance Log“.
•Program Control. Shows all messages written by NetMan Program Control; specifically, which program starts have been allowed, and which have been blocked. For details on working with the Program Control log, see "Program Control“.
•Data Protection Log. Shows all data protection related changes to personal data in the NetMan system. For details on working with the data protection log, see "Data Protection Log“.
•WebDAV Log. Shows all accesses to NetMan using WebDAV. For details on working with the WebDAV log, see "WebDAV Log“.
•WebDAV Locks. Shows all resources that are currently locked because they are being accessed using WebDAV. For details on working with the WebDAV locks log, see "WebDAV Locks“.
![]() The NetMan Desktop Manager Report Center is a Web application. You can call the Report Center/Statistics program from the browser on any system. Prerequisite is that you authenticate yourself at the NetMan Web Server with sufficient permissions. The direct link to the Report Center is: https://<NetMan Server>/nmwebapps/NMWebApps.html. The name of the NetMan Desktop Manager server is usually his FQDN, depending on your network configuration the NetBIOS name or an IP address can also be used.
The NetMan Desktop Manager Report Center is a Web application. You can call the Report Center/Statistics program from the browser on any system. Prerequisite is that you authenticate yourself at the NetMan Web Server with sufficient permissions. The direct link to the Report Center is: https://<NetMan Server>/nmwebapps/NMWebApps.html. The name of the NetMan Desktop Manager server is usually his FQDN, depending on your network configuration the NetBIOS name or an IP address can also be used.
![]() If a certificate error is reported when loading the Report Center or the Statistics program, that means no valid certificate has been registered for the web server. For details on requesting and importing certificates, see "Certificates for the NetMan Web Server“. There is no harm in loading the page when this message is shown; simply select Continue loading the page.
If a certificate error is reported when loading the Report Center or the Statistics program, that means no valid certificate has been registered for the web server. For details on requesting and importing certificates, see "Certificates for the NetMan Web Server“. There is no harm in loading the page when this message is shown; simply select Continue loading the page.
![]() When the Internet filter is globally active, it might prevent the Report Center from starting properly if another instance of the default browser is already running. In this case, open the Report Center in a new browser instance.
When the Internet filter is globally active, it might prevent the Report Center from starting properly if another instance of the default browser is already running. In this case, open the Report Center in a new browser instance.
![]() The Adobe Flash Player plug-in is prerequisite for viewing graphs in the Statistics program.
The Adobe Flash Player plug-in is prerequisite for viewing graphs in the Statistics program.
All logs are shown in the NetMan Log Viewer. You open the Log Viewer in the NetMan Report Center. The Log Viewer with its navigation tools allows you to quickly switch between the different log files:
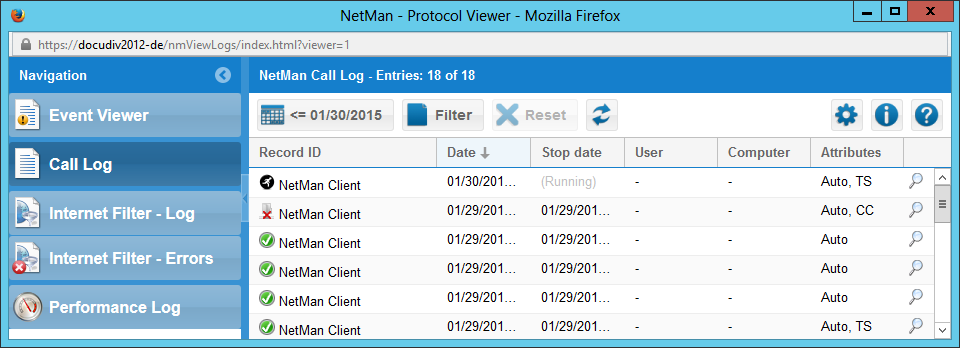
The navigation bar on the left lists the logs by name. Click the desired log here to open it in the main Log Viewer display. You can minimize the navigation bar by clicking on the left-arrow button in its title bar. The action bar above the log display contains controls for various tasks, such as filtering the data records for display. The following controls are in the action bar:
Jump to date. Shows all data records written on or since a specified date.
Filter. Filters the queried data to show only those records which match the specified filter criteria.
Reset. Reset the filter.
Update. Updates the displayed content.
Settings. Opens the Settings program.
Information. Shows information about the program.
Help. Opens the Help program.
Jump to date
This function filters the queried data based on date. You can view either all data records written on the specified date, or all records written on or after the specified date.
Date. Date for filtering the data.
Entries. Specifies the query mode:
•from the selected date. Loads all data records written on or after the selected date.
•for the selected date. Loads all data records written on the selected date.
Click on Show to load the filtered data in the Log Viewer.
Filter
This function filters the queried data based on date. Which options are available here depends on the type of log file displayed:
Event Log:
Level. Severity level of the event., such as "Warning" or "Error."
Code. Error code.
Module. (NetMan) module in which the event occurred.
Script. Script that was running when the event occurred.
Message. Shows only data records with message-field values containing the character string entered here.
Users: Shows data records with user-name values containing the string entered here.
Computer. Shows data records that have computer-name values containing the string entered here.
IP address. Shows data records with IP addresses containing the string entered here.
Call log:
Record ID. Shows data records that contain the specified record ID.
User: Shows data records with user-name values containing the string entered here.
Computer. Shows data records that have computer-name values containing the string entered here.
Stop date. Filters according stop date: Can load either all records containing the specified stop date, or all records with a stop date matching or later than the specified date.
Attributes. Filters the data records to show either those which contain, or those which do not contain the specified attribute(s).
Internet Filter: Activity Log:
Protocol. Data transfer protocol (either HTTP or HTTPS).
Application. Shows data records with application-name values containing the string entered here.
Host. Internet host domain.
URL. Internet address.
User: Shows data records with user-name values containing the string entered here.
Computer. Shows data records that have computer-name values containing the string entered here.
Upload. Size of the upload.
Download. Size of the download.
Access. Filters records according to use of the specified Internet filter.
Access rule. Filters records according to use of an access rule containing the specified character string.
Content. Filters records according use of the specified Content filter.
Internet Filter: Error Log:
User. Shows data records with user-name values containing the string entered here.
Computer. Shows data records that have computer-name values containing the string entered here.
Application. Shows data records with application-name values containing the string entered here.
Message. Shows only data records with message-field values containing the character string entered here.
Performance Log:
Server. Shows only those records with a server-name value containing the string entered here.
Load. Shows only those records with a load value defined by the selected expression.
Duration. Shows only those records with a duration value defined by the selected expression.
Sessions. Shows only those records that show a number of sessions corresponding to the selected expression.
Program Control:
Access. Why access to the program was allowed/prohibited.
Program. Which program was launched.
Path. Program path.
Parameter. Parameter for program start.
Parent (with process ID). Process that launched the program.
Certificate. Certificate for the program.
MD5 hash. MD5 hash of the program.
Computer. Computer on which the program was started.
OS. Operating systems on which the program was started.
User. User that launched the program.
Script. Script that started the program.
Data Protection Log:
Action. Data protection operation that was performed.
User. User whose data has been changed.
Module. NetMan module that processed the changes.
WebDAV Log:
State. Operation state (either “Success” or “Failed”)
Operation. Type of WebDAV operation.
User. User who accessed the resource.
IP address. IP address from which the user accessed the resource.
Resource. Resource that was queried.
URL. URL of the resource.
Error. Errors while accessing the resource.
WebDAV Locks:
Scope. Lock state (either “Exclusive”, “Shared” or “Unknown”)
Owner. User who currently “owns” (uses) the resource.
Path. Path of the locked resource in the file system.
URL. URL of the locked resource.
Device path. Device path.
The Reset button clears all filter settings in the Filter dialog. Set applies the filter, and Cancel closes the filter dialog without applying the filter.
Control settings
You open the settings by clicking the gear button on the right above the list. In the Settings dialog: you can define the maximum number of data records that can be loaded in the Log Viewer display: The default settings is 5000. Keep in mind that the number of data records loaded affects the response time of the Log Viewer. The higher the number, the longer it takes to process the records.